No.3064
Consumer Survey on Health Consciousness and Dietary Habits 2022
40% of Young Female Group Feels Discrepancy in Her BMI Value and Body Image, and 90% of Them Tend to Consider Themselves as Fatter than They Actually Are
Yano Research Institute (the President, Takashi Mizukoshi) carried out a consumer survey, and found out the relationship between health consciousness and food consumption by consumers by using AI (machine learning) analysis and multivariate analysis.
Summary of Research Findings
This online consumer survey was performed to men and women in the ages from 20 to 79 nationwide. BMI values were calculated from height and weight of the respondents. The respondents chose one answer from “Does not apply”, “Somewhat applies”, and “Applies” to each question asking whether they think their body shape "Obese” and whether their body shapes “Thin”.
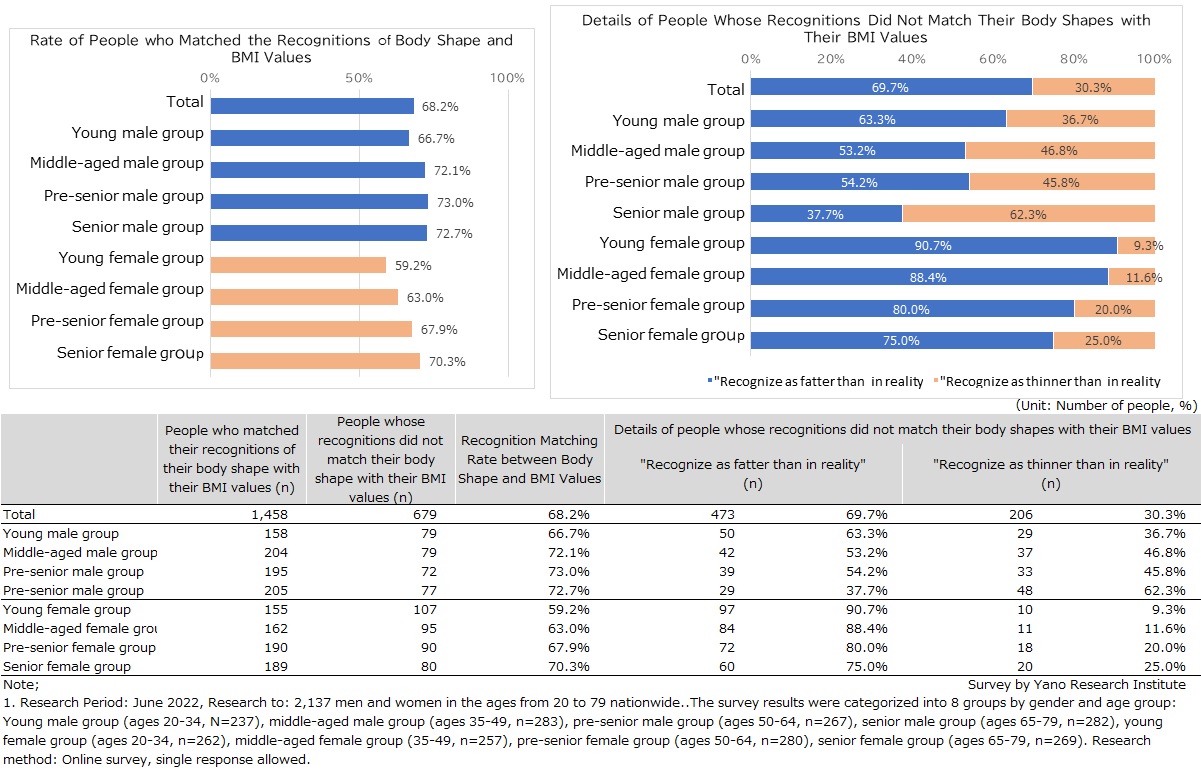
Those people whose recognitions matched their BMI values and their own body images were as follows: Those respondents with their actual BMI values less than 18.5 who responded “Somewhat applies” or “Applies” to the question asking whether their body shapes were “Thin”; those respondents with their BMI values between 18.5 and less than 25 who responded “Does not apply” to both of the questions asking whether their body shapes were “Thin” and “Obese”, and those respondents with their BMI values 25 or above who responded as “Somewhat applies” or “Applies” to the question asking whether their body shapes were “Obese”. Of the entire respondents (n=2,137), the rate of those who matched the recognitions of their BMI values with their body shapes was 68.2% (n=1,458). As they get older, both men and women were confirmed to have shown a tendency of matching recognitions between their BMI values and body shape.
On the other hand, those respondents who “recognized as fatter than in reality” among those who did not match their recognitions of their BMI values with their own body images were as follows: Those respondents with their BMI values less than 18.5 but responded “Does not apply” to the question asking whether their body shapes were “thin”, and also responded “Somewhat applies” or “Applies” to the question asking whether their body shapes were “Obese”, and those respondents with their BMI values between 18.5 or more and less than 25 who responded “Somewhat applies” or “Applies” to the question whether their body shapes were “Obese”, occupying 69.7% (n-473).
When observing by gender and by age group, the rate of young female group (ages 20-34, n=262) whose recognitions matched their BMI values and their own body images was 59.2% (n=155), the lowest among the 8 groups. 40.8% (n=107) of people in this group contradicted in recognitions between actual BMI values and their body shapes. 90.7% (n=97) of people in this group “recognized themselves as fatter than in reality”, the highest rate than other 7 groups. The Ministry of Health, Labour, and Welfare in its second Health Promotion Measures has set the goal to reduce underweight young women due to bad effect to health, but this questionnaire has shown that these people should first recognize their body shape correctly.
Noteworthy Topics
Underweight Young Female Group Should be Encouraged to Take Calorie-Conscious Nutrition
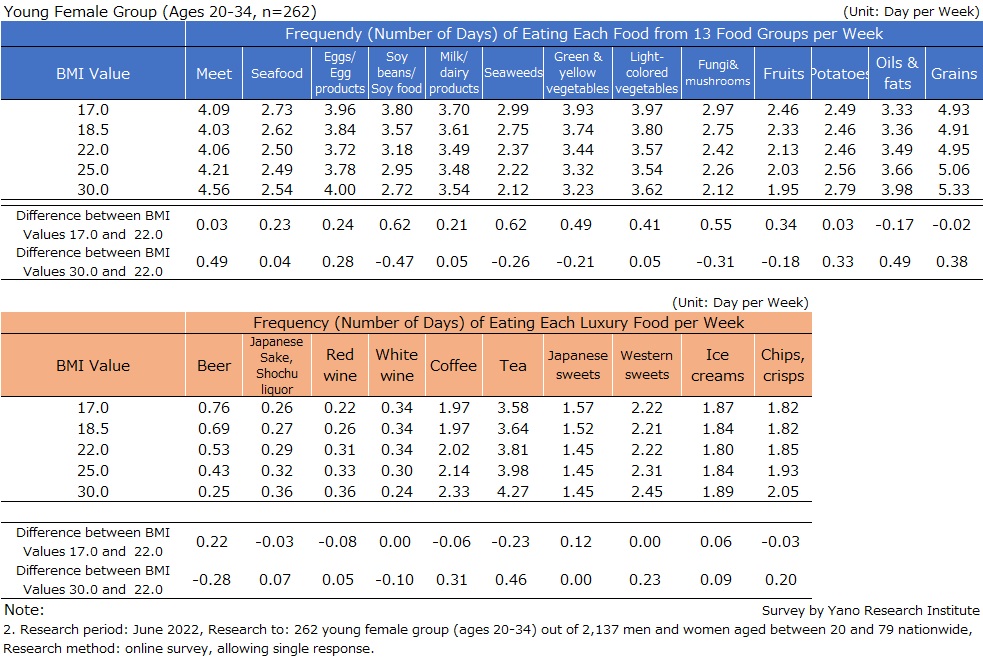
This research asked the respondents to choose from “Eats infrequently (0-1 day a week)”, “Eats often (2-4 times a week)” and “Eats everyday (5 days or more a week)” regarding the diet frequency of 13 food groups including meats, seafood, green & yellow vegetables, etc., and also regarding the diet frequency of luxury foods that include liquor, Japanese & Western sweets, snack food, etc.
In the research, machine learning (using deep learning as the algorithm) was performed, with the respondents’ BMI values set as explanatory variable, and the survey results on the frequency (number of days per week) of taking “13 food groups” and “luxury foods” set as objective variable. Any 5 BMI values (17 [underweight], 18.5 [between underweight and normal weight], 22 [normal weight], 25 [between normal weight and obese class I], and 30 [between obese class 1 and 2] were selected to be set up into the results of machine learning, by which to estimate the average number of days per week that people with each BMI value eat 13 food groups and luxury foods.
Supposing the people with BMI value 22 (normal weight) ate adequate volume of 13 food groups and luxury foods estimated from the frequency (number of days) per week, the difference from the number of days those food was eaten by those people with BMI value 17 (underweight) and people with BMI value 30 (between obese class 1 and 2) was calculated.
When observing the number of days per week the 13 food groups were taken by young female group (ages 20-34), it was found out that people with BMI value 17 (underweight) ate more “soy beans & soy products”, “seaweeds”, and “fungi & mushrooms” than those with BMI value 22 (normal weight”. While no large difference was observed between people with low BMI value and high BMI value from the number of days per week “luxury foods” were taken, it was found out that the lower BMI value was, the larger the number of days per week “Beer” was taken.
Although this research was not able to mention about food volume, it confirmed that the underweight, young female group with their BMI values 17.0 had a tendency of eating low-calorie foods such as “seaweeds”, “fungi & mushrooms”, “green & yellow vegetables”, and “light-colored vegetables” for larger number of days per week than normal-weight young female group with their BMI values 22.0. Such underweight, young female group needs to be encouraged for being aware of their nutritional intake, which is also calorie conscious for their health.
Research Outline
2.Research Object: Total 2,137 men and women from 20s to 70s nationwide
3.Research Methogology: Online consumer survey (questionnaire)
About the Research
This online consumer survey was performed to men and women in the ages from 20 to 79 nationwide to ask about health conditions, status of taking 13 food groups, food they usually consume in expectation of health effects, food considered to have health effects, and luxury foods, etc., where to buy food, SNS often used, TV programs often watched, how to collect information on health and food, status of exercises, and was responded by 2,137 people.
The survey results were categorized into 8 groups by gender and age group: Young male group (ages 20-34, N=237), middle-aged male group (ages 35-49, n=283), pre-senior male group (ages 50-64, n=267), senior male group (ages 65-79, n=282), young female group (ages 20-34, n=262), middle-aged female group (35-49, n=257), pre-senior female group (ages 50-64, n=280), senior female group (ages 65-79, n=269).
*BMI (Body Mass Index) is a person's weight in kilograms divided by the square of height in meters.
*The categorization of BMI values (less than 18.5, between 18.5 or more and less than 25, and 25 or more) used in the analysis regarding people's recognitions on their body shapes and actual BMI values in this research was referred to judgement from “Obesity Degree Categorization” defined by Japan Society for the Study of Obesity (JASSO).
*”13 food groups” in this research refer to 10 food groups (fish, oil, meat, milk, dairy products, green & yellow vegetables, seaweeds, potatoes, eggs, soy products, and fruits) developed by Tokyo Metropolitan Geriatric Hospital and Institute of Gerontology for food intake diversity scores that was added to three food groups, light-colored vegetables, fungi/mushrooms, and grains.
<Products and Services in the Market>
2,137 men and women in the ages between 20 and 79 nationwide
Published Report
Contact Us
The copyright and all other rights pertaining to this report belong to Yano Research Institute.
Please contact our PR team when quoting the report contents for the purpose other than media coverage.
Depending on the purpose of using our report, we may ask you to present your sentences for confirmation beforehand.