No.2645
Pachinko Parlor Operators in Japan: Key Research Findings 2020
Profit Increased but Operating Income Decreased for 131 Pachinko Parlor Operators in FY2019
Yano Research Institute (the President, Takashi Mizukoshi) has found out the financial performance trends of pachinko parlor operators, based on the average values of major financial indicators of 131 pachinko parlor operators.
Summary of Research Findings
For this research, 131 pachinko parlor operators were randomly sampled from a total of 2,609 pachinko parlor operators nationwide listed in the “YANO Pachinko Database”. We analyzed the business performance trends over the three years from FY2017 to FY2019 based on the average value of key indicators in their financial statements.
Noteworthy Topics
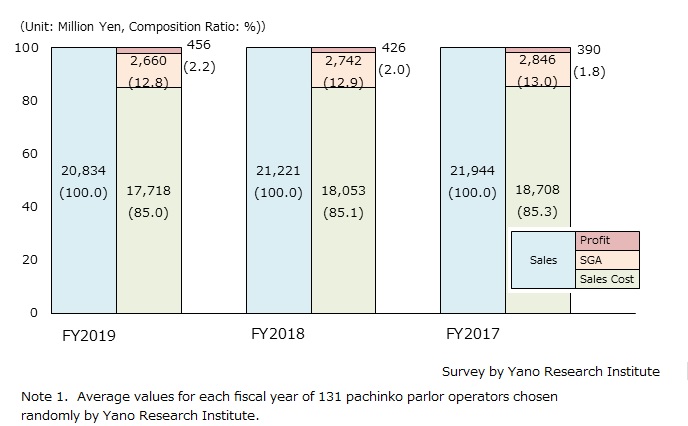
Financial Performance Trends of 131 Pachinko Parlor Operators
<Sales & Cost of Sales>
Comparing the average sales for FY2019 (20,834 million yen) to that of FY2017, it dropped by 5.1%. The decrease in the number of customers and shift to new gaming machines caused the significant decline in sales. Although the average sales cost sustained composition ratio of 85% over the past few years, it diminished to 85.1% in FY2018 and 85.0% in FY2019.
<Gross Margin >
By reducing the sales cost, composition ratio of gross margin in FY2019 rose by 0.1 percentage points from the previous fiscal year to 15.0%. Nevertheless, the average gross margin dropped to 3,116 million yen, down by 1.6% from the previous fiscal year. While there are companies holding down their sales cost to secure gross margin, it was not enough to compensate for the decline in sales.
<SGA Expenses>
The average SGA expenses for FY2019 diminished by 3.0% from the preceding fiscal year, while composition ratio also dropped by 0.1 percentage points. However, as mass replacement of old gaming machines with new gaming machines is required by FY2021 to comply with the revision of Gaming Machine Guidelines that came into force in February 2018, SGA expenses may swell hereafter, exerting further pressure on profit.
<Operating Income>
Due to reductions in sales cost and SGA expenses, operating income continues to rise. It rose by 9.2% year-on-year in FY2018, and by 7.0% year-on-year in FY2019. Similarly, composition ratio has increased, from 1.8% in FY2017 to 2.0% in FY2018 and 2.2% in FY2019.
Research Outline
2.Research Object: Pachinko parlor operators
3.Research Methogology: Data aggregation and analysis by our specialized researchers on “YANO Pachinko Database”
Pachinko Parlor Operators
For this survey, we randomly sampled 131 pachinko parlor operators from a total of 2,609 pachinko parlor operators nationwide listed in the “YANO Pachinko Database”. We analyzed the business performance trends over the three years from FY2017 to FY2019 based on the average value of key indicators in their financial statements.
Target pachinko parlor operators include 12 major companies (operating more than 20 parlors), 28 second-tier companies (operating 10 to 19 parlors), 38 mid-sized companies (operating 4-9 parlors), and 55 small-sized companies (operating 1-3 parlors). An average of parlors operated by the 131 companies was 7.9.
Please note that giant operators and those that have rapidly expanded the number of parlor openings in a short term, such as Maruhan, Dynam, Undertree, Gaia, NEXUS, and Niraku, were excluded from the population prior to the sampling of the survey target.
<Products and Services in the Market>
Pachinko Parlors and Parlor Operators
Published Report
Contact Us
The copyright and all other rights pertaining to this report belong to Yano Research Institute.
Please contact our PR team when quoting the report contents for the purpose other than media coverage.
Depending on the purpose of using our report, we may ask you to present your sentences for confirmation beforehand.