No.3185
Financial Performance Trends of Pachinko Parlor Operators in Japan: Key Research Findings 2022
An Average of FY2021 Financial Performance of 123 Pachinko Parlor Operators Indicated Growth but No Full-fledged Recovery
Yano Research Institute (the President, Takashi Mizukoshi) has found out the financial performance trends of pachinko parlor operators, based on the average values of major financial indicators of 123 pachinko parlor operators.
Summary of Research Findings
This research is conducted on 123 pachinko parlor operators randomly sampled from a total of 2,078 pachinko parlor operators nationwide listed in the “YANO Pachinko Database”. We analyzed the business performance trends over the three years from FY2019 to FY2021 based on the average value of key indicators in their financial statements.
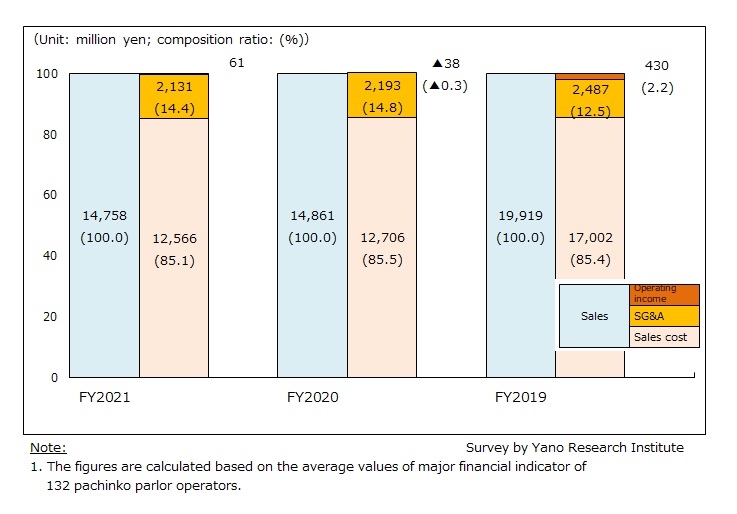
In FY2021, the average sales of the 123 companies was 14,758 million yen, the cost of sales was 12,566 million yen (85.1% by composition ratio), SG&A was 2,131 million yen on average (14.4%), and the average operating profit was 61 million yen (0.4%). Despite a 0.7% decrease in sales, gross margin rose by 1.7% due to 1.1% decline in cost of sales. As businesses squeezed SG&A expenses by 2.8% from the preceding fiscal year, they succeeded in turning operating profit into black. Still, their operating margin was low at 0.4%.
Noteworthy Topics
Financial Performance Trends of at 123 Pachinko Parlor Operators
[Sales & Cost of Sales]
The average sales of pachinko parlor operators for FY2021 decreased by 0.7% from the previous fiscal year to 14,758 million yen.
Impacted by the store closures and shortened business hours due to pandemic activity restrictions, pachinko parlors saw considerable decline in sales, down by 25.4% on year-on-year basis in FY2020. Although the restrictions were gradually eased in FY2021, the market did not see full recovery. One of the reasons for sluggish recovery was the removal of gaming machines that were popular among pachinko fans, which were replaced by new machines that conforms to new regulations.
[Gross Margin]
Despite the sales shrinkage, reduction in cost of sales led the gross margin to reach 2,192 million, up by 1.7% from the previous fiscal year. Composition ratio of the gross margin also rose to 14.9%, up by 0.4 percentage points from the previous fiscal year. The numbers indicated that the companies struggled to cutdown the cost of sales to secure gross margin.
[SG&A Expenses]
The SG&A expenses for FY2021 decreased to 2,131 million yen by average, down by 2.8% from the preceding fiscal year. In view of the composition ratio, SG&A expenses increased by 2.3 percentage points from 12.5% in FY2019 to 14.8% in FY2020. However, it dropped again by 0.4 percentage points in FY2021 to 14.4%, indicating the composition ratio of SG&A expenses was in 14% range for two consecutive years. Although SG&A expenses by value decreased by 11.8% in FY2020 and 2.8% in FY2021 on year-on-year basis, because of a significant drop in sales since FY2020, the composition ratio of SG & A remained relatively high.
According to similar studies in the past, the composition ratio of SG&A has been exceeding 10% since FY2008. The pachinko parlor operators have been under pressure partly due to the cost of purchasing new regulation-compliant machines to conform to the revision of the Pachinko Machine Regulation that came into force in February 2018, which mandated the parlors to remove old machines by the end of January 2022. For FY2022 and beyond, the cost of installing smart gaming machines (smart pachinko machine and smart pachislot machines) and ancillary devices, as well as rising electricity prices, may lead to an increase of SG&A expenses.
[Operating Income]
An average operating income of the pachinko parlor operators for FY2021 was 61 million yen. While the composition ratio of operating income at pachinko parlors had been in the 2% range for years, it fell into the red in FY2020. Although reductions in cost of sales and SG&A expenses contributed to the recovery of operating profit, operating margin for FY2021 was still low at 0.4% on average.
Research Outline
2.Research Object: Pachinko parlor operators
3.Research Methogology: Data aggregation and analysis by our specialized researchers based on “YANO Pachinko Database”
For this survey, we randomly sampled 123 pachinko parlor operators from a total of 2,078 pachinko parlor operators nationwide listed in the “YANO Pachinko Database”. We analyzed the business performance trends over the three years from FY2019 to FY2021 based on the average value of key indicators based on the financial information of those operators.
Target pachinko parlor operators include 7 major companies (operating more than 20 parlors), 26 second-tier companies (operating 10 to 19 parlors), 37 mid-sized companies (operating 4-9 parlors), and 53 small-sized companies (operating 1-3 parlors). Average number of parlors operated by the 123 companies was 7.2.
Please note that giant operators and those that have rapidly expanded the number of parlor openings in a short term, such as Maruhan, Dynam, Undertree, Gaia, NEXUS, and Niraku, were excluded from the population prior to the sampling of the survey target.
Published Report
Contact Us
The copyright and all other rights pertaining to this report belong to Yano Research Institute.
Please contact our PR team when quoting the report contents for the purpose other than media coverage.
Depending on the purpose of using our report, we may ask you to present your sentences for confirmation beforehand.